How to Create Flexible S-Curves for Any Cutoff Period Using Primavera P6 and Excel
Dec 12, 2024
Struggling to align your S-Curve with a specific cutoff date like the 25th? Misalignment in your S-Curve reporting can lead to inaccuracies, causing discrepancies in planned value and schedule variance. Don’t worry—this guide will walk you through the exact steps to create precise and flexible S-Curves using Primavera P6 and Excel.
While it’s possible to retrieve data for the 25th in Primavera P6 by manually running month-by-month cutoffs to get the planned value, this process is time-consuming and repetitive—especially if you’re still finalizing your baseline schedule.
Here’s a simple solution: extract the daily planned value from your baseline schedule, store it in Excel, and use a lookup formula to dynamically calculate the planned value for any cutoff period.
Follow the steps below for a detailed guide on how to streamline this process. Let’s dive in!
Step 1: Open Your Project Schedule in Primavera P6

Start by opening any cost-loaded baseline schedule in Primavera P6. A cost-loaded schedule is essential for generating an accurate cost S-Curve.
- Navigate to the Activity Usage Spreadsheet.
- Right-click to check the spreadsheet fields and ensure the Total Budgeted Cost column is included.
Step 2: Update the Timescale

Next, adjust the timescale to display data in daily intervals:
- Right-click on the schedule area.
- Select Timescale and change the date interval to Daily.
This adjustment will give you detailed cost data for each day, which is crucial for accurate reporting.
Step 3: Export Data to Excel

To prepare the data for your S-Curve:
- In the activity usage section, click the Collapse button to condense the data.
- Copy the data and paste it into a new Excel sheet.

If your cost data includes currency symbols (e.g., “SAR” or “USD”):
- Select all the data.
- Press Ctrl+F and replace the currency symbols with a blank to ensure a valid numerical value.
Step 4: Set Up Your S-Curve Table in Excel

- Create a new sheet in Excel for the S-Curve report.
- Add the following rows to your table:
- Cumulative Planned Value
- This Period's Planned Value
For the periodic intervals:
- Enter the 25th of the first month of your schedule in the first column.
- Enter the 25th of the next month in the second column.
- Drag these dates across to create a series for all subsequent months.
Step 5: Use HLOOKUP for Planned Values

To dynamically retrieve planned values for a specific cutoff date:
- Use the HLOOKUP formula:
- Select the date as the
lookup_value. - Use rows 1 and 2 from your baseline schedule data as the
table_array. - Enter “2” to reference the second row and “0” for an exact match.
- =HLOOKUP(C2,Sheeet!1:2,2,0)
- Copy the formula across all columns to get the PV of each periodic date.
Step 6: Calculate 'This Period' Planned Values

To determine the planned value for each period:
- Subtract the previous total cost from the current cumulative cost. (Except for the first column)
- Apply this formula across all columns.
This will calculate the planned value for each reporting period.
Step 7: Build the S-Curve in Excel

With your data ready:
- Select the Cumulative Planned Value and This Period's Cost data.
- Go to Insert > Recommended Charts, and click ok.
Customize the chart:

- Click on "Change chart type" and select the combo chart.
- Assign the This Period's Cost to the secondary axis as a clustered column chart.
- Set the Cumulative Cost as a line chart.
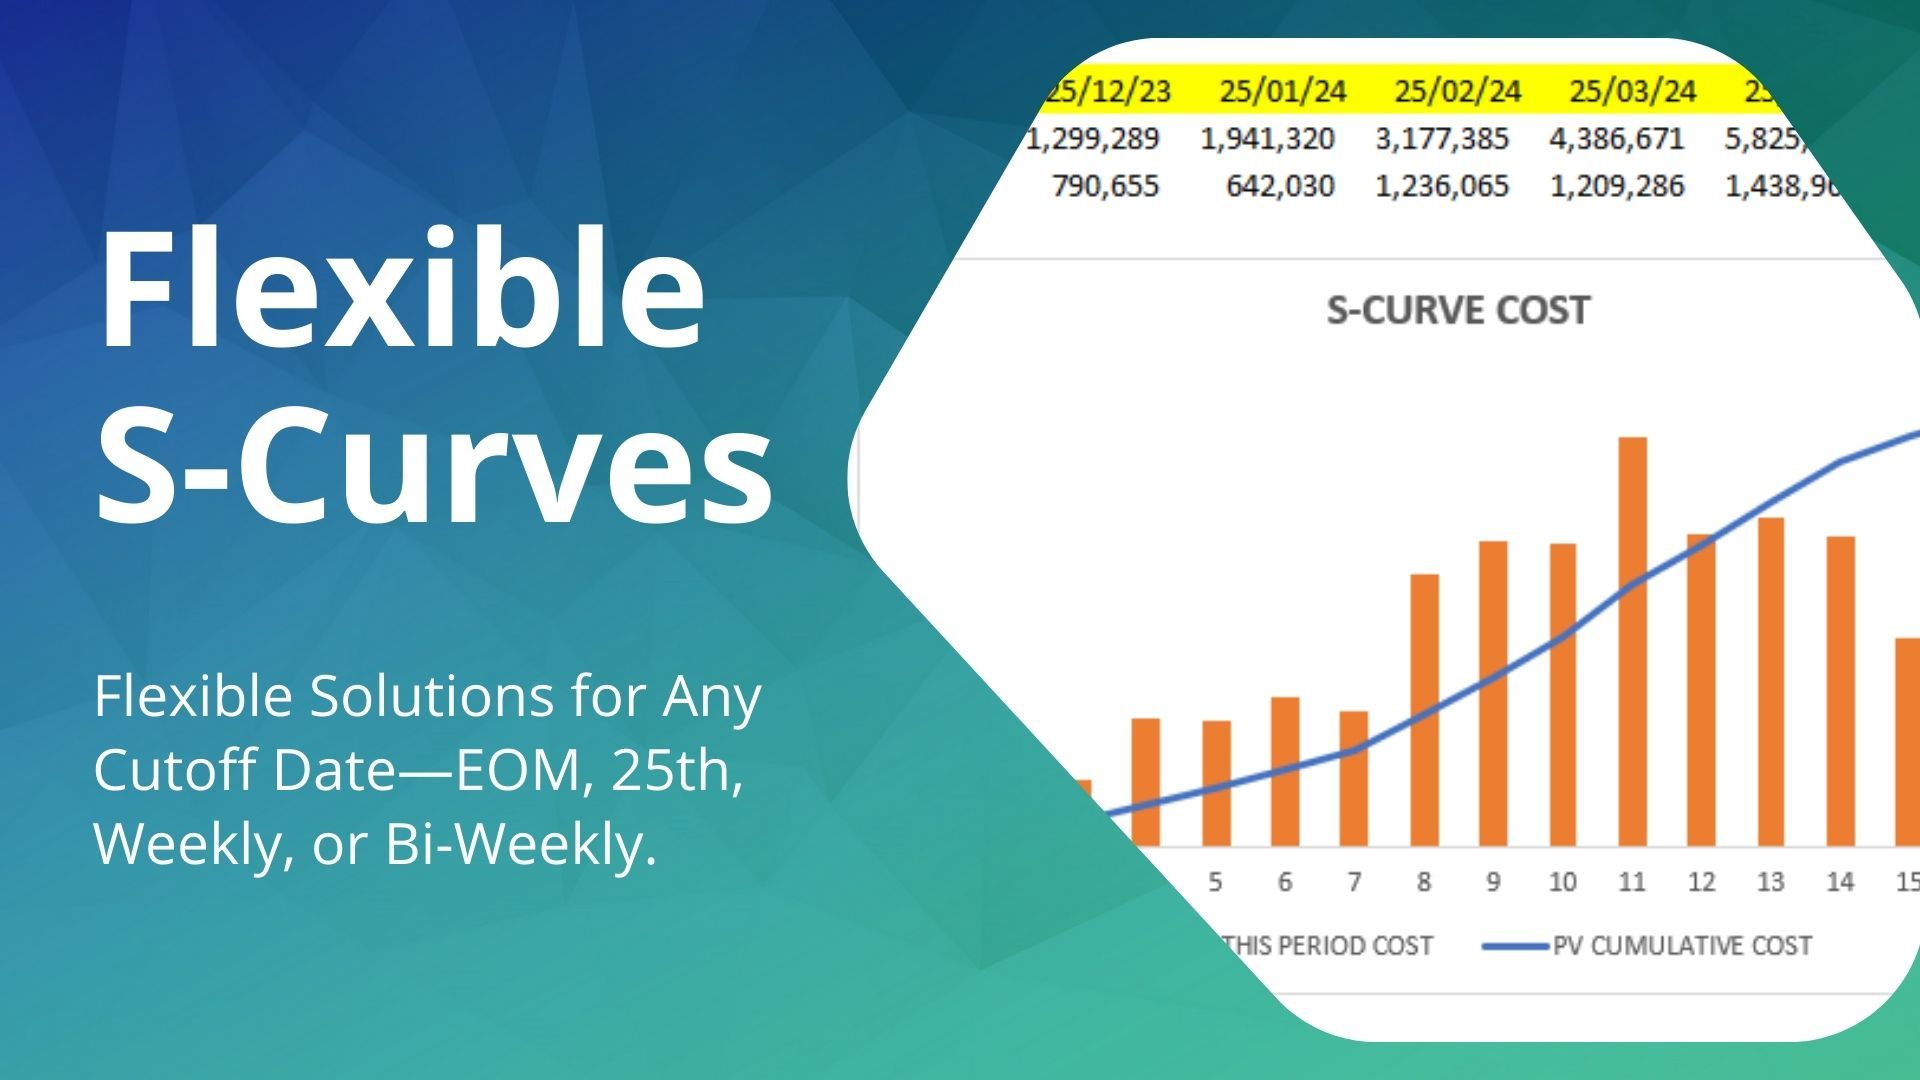
Your S-Curve is now ready!
Step 8: Compare Cutoff Periods (Optional)

For additional insights, compare S-Curves for different cutoff dates:
- Save your current chart as an image to preserve it.
- Adjust the cutoff period to the end of the month and regenerate the S-Curve.
- If an error occurs in the last column, simply update the date to match the finish date of your schedule.
By comparing these charts, you’ll see how the choice of cutoff date affects your planned values and progress reports.
Why Aligning Cutoff Dates Matters
Misalignment in cutoff dates can lead to reporting gaps:
- If your S-Curve uses an end-of-month cutoff while your consultant requires data as of the 25th, progress from the 26th to the end of the month will be excluded.
- This causes discrepancies in your planned value, schedule variance, and Schedule Performance Index (SPI).
To maintain accuracy, always ensure the data date in Primavera matches your cutoff date.
Why Use the Excel Lookup Method Over Manual P6 Retrieval?
- Retrieving cutoff dates manually in Primavera P6 is time-consuming and repetitive, especially during baseline preparations or revisions.
- With the Excel lookup method, planning engineers can dynamically retrieve planned values for any cutoff date in seconds.
It’s faster, more accurate, and ensures your S-Curve aligns perfectly with reporting requirements.
Conclusion
Creating a flexible and accurate S-Curve is simple with this step-by-step process. By aligning your data to the required cutoff date, you’ll ensure accurate reporting for your projects—whether you’re working with monthly, bi-weekly, or weekly intervals.
If you're a subscriber, you can access the video lesson for added clarity. Not subscribed yet? Don’t miss out on valuable resources—subscribe now!
See you in the next guide!
Everything You Need to Build a Complete Baseline Schedule!
- 15 Comprehensive Sections with detailed, easy-to-follow videos.
- Hands-On Exercises for every lesson to enhance your learning.
- Downloadable Templates & Baseline Deliverables so you can start applying your knowledge immediately.
Stay connected with news and updates!
Join our mailing list to receive the latest news, free templates, and updates from our team.
Don't worry, your information will not be shared.
We hate SPAM. We will never sell your information, for any reason.

